
Observability for Agentic Systems: Tracking Decisions, Not Just Uptime
Why monitoring AI agents means logging context, tool calls, and policy decisions — and how to avoid drowning in data
Your finance agent just completed month-end close. Every API call succeeded. Zero errors. Green dashboards across the board. Three cycles later, the controller discovers that half the account commentaries used stale data. The agent called the right tools, returned no exceptions, and produced plausible output. It just made the wrong operational decision.
This is the fundamental challenge of agentic systems in production. The question shifts from "Is it running?" to "What did it decide, why, and was that outcome good?" Without answers, bounded autonomy becomes unmanaged risk.
Traditional observability tracks technical health: latency, error rates, database throughput. Agentic systems demand a different layer. An agent reasons, chooses tools, retrieves context, calls external systems, and produces probabilistic outputs. Two identical inputs can produce completely different decision paths. Your observability must now answer three simultaneous questions: what happened technically, what the agent decided, and what business impact that decision had.
Why Agent Observability Is Fundamentally Different
The difficulty isn't that the technology is new. It's that the object being observed is more complex. In a standard application, execution flow is linear: request in, process, database read, response out. When something breaks, you trace logs and spans to find the bottleneck.
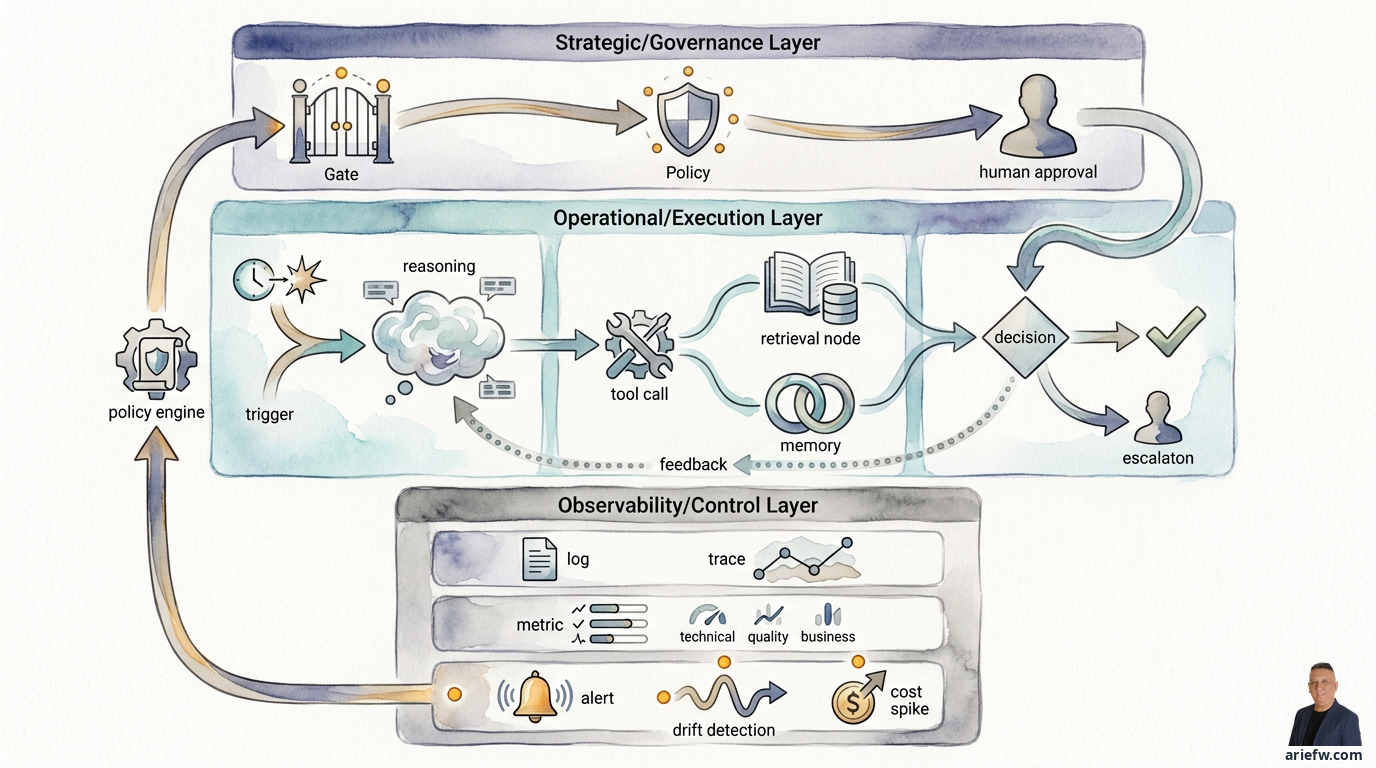
An agentic system layers triggers from users or events, orchestrators that decompose tasks, context retrieval from RAG or memory, model-generated reasoning, sequential tool calls, policy engine evaluations, human approval gates, and final actions. Failure rarely appears as a technical error. The agent can call every API successfully but choose the wrong action. It passes technically but violates policy. It completes the task with poor decision quality.
This probabilistic nature changes how you monitor. Even with identical prompts, tools, and data, outputs vary. You can't rely on error codes alone. You need to monitor behavioral patterns. A refund agent that never fails technically might start escalating cases it previously handled automatically — a behavioral drift that silently reduces productivity. A procurement agent might create requests but choose more conservative approval paths because retrieval policies shifted. No technical incident, but cycle time worsens.
In enterprise contexts, observability is a governance mechanism. Risk, audit, and compliance teams need to answer: what context did the agent use, what tools were called, what policies applied, when did the agent request approval, who corrected the output, and how did the decision affect the business transaction? If you can't reconstruct this chain, you have no foundation for incident investigation, audit, or expanding autonomy.
What to Log: The Six Components of Agentic Decision Trails
The most common mistake is logging only prompts and responses. For enterprise use, that's dangerously shallow. You need the end-to-end decision trail:
Trigger and initial context. How did the workflow start — user, system event, schedule, or handoff from another agent? Log the originating principal, time, channel, and relevant business object (invoice number, ticket ID, order ID).
Prompt and runtime instructions. Not every detail, but enough to understand which system instructions were active, what parameters were used, which prompt or workflow version ran, and what model configuration was applied. This becomes essential when comparing agent versions or investigating behavior changes.
Retrieved context. If the agent uses RAG, knowledge graphs, or memory, log which documents or context chunks were retrieved, from which source, their version or timestamp, and whether access passed permission checks. Without this, you can't explain why the agent made a particular decision.
Model response and reasoning artifacts. You don't need raw chain-of-thought, but you need enough for audit and debugging: action plan summaries, intent classifications, confidence signals, or structured decision outputs used for subsequent steps. Store enough for accountability, but avoid leaking sensitive data.
Tool calls and results. Every tool invocation should record: which tool, key parameters, success or failure, latency, retry attempts, and state changes in the target system. For finance close, IT operations, or procurement workflows, this is where the agent starts affecting operational reality.
Policy decisions, human approvals, and final actions. If a policy engine, approval workflow, or guardrail was involved, log it: which policy was evaluated, the result (allow, deny, escalate, require approval), who the human approver was, the final decision, and what action was actually executed. Without this layer, you have technical logs, not governance logs.
More logging means more data exposure risk. Agentic systems touch customer data, payroll information, vendor details, contracts, financial data, or internal incident records. Design logging with redaction for sensitive data, tokenization for identifiers, secure storage with access controls, clear retention policies, and segregation of duties. Auditability must increase without expanding the blast radius.
Metrics: Three Distinct Groups, Not One Dashboard
Many implementations stop at latency and error rates, declaring the system "observable." Agentic systems need three separate metric groups:
Technical metrics keep runtime healthy. Monitor latency per step and end-to-end, token or compute cost per transaction, tool error rates, retry rates, timeout rates, fallback usage, failure mode distribution, and availability of critical components like model gateways, vector stores, policy engines, and tool registries. These help platform teams maintain stability but don't tell you if the agent is trustworthy.
Quality metrics assess whether the agent makes good decisions. This is what distinguishes agentic observability from application observability. Track accuracy against expected outcomes, hallucination or unsupported answer rates, escalation rates, policy violation rates, human correction rates, rework rates after agent actions, tool selection accuracy, and grounding quality against retrieved context. Some quality metrics can't be fully automated — you'll need a combination of automated evaluation, manual sampling, user feedback, and domain expert review.
Business metrics measure whether the agent actually improves operations. Connect observability to cycle time, cost per transaction, resolution rate, touchless rate, backlog reduction, revenue or working capital impact, and customer or employee satisfaction. An agent might look healthy technically and score well on quality, but if cost per case doesn't drop and backlog doesn't improve, the design needs revisiting.
Separate these three groups. Mixing them makes it hard to diagnose root causes. Latency spikes are a technical issue. Rising human correction rates are a quality issue. Stagnant cycle time is a business or process design issue.
Monitoring for Drift Before It Becomes an Incident
Once metrics are defined, decide what to monitor continuously and when to alert. Problems in agentic systems often appear as pattern shifts, not total failures.
Monitor for behavioral drift — changes in escalation rates, unusual output length shifts, tool usage pattern changes, or sharp classification distribution changes. Causes can include model updates, prompt changes, retrieval corpus shifts, data distribution changes, or tool response modifications.
Watch for tool usage anomalies. If a procurement agent that normally calls contract and vendor APIs suddenly starts hitting manual exception paths more frequently, that's a signal. If an IT operations agent runs certain runbooks far above baseline, investigate for drift, bugs, or environmental changes.
Track output distribution changes. More "I don't know" responses, more conservative recommendations, more human-cancelled actions, or more cases ending without resolution — these often signal declining agent quality before they become visible incidents.
Not every alert is a technical incident. Categorize alerts into four types:
Technical incidents: model gateway down, tool API timeout
Policy breaches: agent attempted unauthorized actions, access violations
Quality degradation: human correction rates spiking, unsupported answers increasing
Cost spikes: token cost per transaction rising, excessive tool calls, fallback to expensive models
Each category needs a different response owner and escalation path.
What This Means for Builders
If you're building agentic systems for enterprise use, here's what this implies for your architecture:
Logging is a control plane decision, not an afterthought. Design your logging schema before you deploy your first agent. Retroactively adding decision tracing is painful and often incomplete.
You need separate metric pipelines for technical, quality, and business data. One dashboard that mixes all three creates noise, not signal.
Behavioral drift is your new incident type. Your on-call rotation needs to handle "the agent is acting differently" as seriously as "the API is down."
Governance logging is non-negotiable for regulated industries. If you can't reconstruct a decision trail for audit, you can't deploy agents in finance, healthcare, or legal contexts.
Implementation Lens
Start with the highest-risk workflows first. A knowledge assistant for internal documentation needs lighter logging than a refund automation system or a finance exception handler. Design observability by risk tier:
Tier 1 (low risk): Internal knowledge tools, draft generators. Log trigger, prompt version, and final output. Sample quality metrics weekly.
Tier 2 (medium risk): Customer-facing recommendations, workflow assistants. Log full decision trail, quality metrics daily, technical metrics real-time.
Tier 3 (high risk): Financial transactions, access control changes, compliance workflows. Log everything, redact sensitive data, implement real-time policy breach alerts, maintain full audit trail with tamper-evident storage.
A few warning signs that your observability isn't ready for scale: you can't trace a single agent run from trigger to business outcome; you have no separation between technical, quality, and business metrics; you haven't defined what sensitive data gets redacted and who can access logs; you treat all alerts as the same incident type; or you have no systematic process for reviewing agent quality in production.
Observability for agentic systems isn't a dashboard project. It's a control plane decision. Get it right, and you build the foundation for trust, accountability, and responsible autonomy. Get it wrong, and you won't know what your agents are doing until it's too late — and by then, they'll already be acting on your behalf.
For a deeper dive into the architecture of agentic observability, including detailed logging schemas and alerting thresholds, read the full article at the canonical URL.